
 Home

Battery Duration Explained: The Truth About the
Here is a scenario that plays out across the Philippines every typhoon season.
A system was specified, sold and installed as a "2-hour battery." The grid goes down. The client expects two hours of backup. What they get is less — and now there is a conversation to have that nobody wanted.

The gap between the label and the site is not usually a fault. It is a misunderstanding about what a rated duration figure actually promises. This guide closes that gap.
What "2h" means on paper
Duration is energy divided by power:
|
T = E ÷ P |
Where:
T = duration (hours)
E = energy capacity (MWh)
P = power (MW)
A 200 MWh system with 100 MW of power yields:
|
200 MWh ÷ 100 MW = 2 hours |
Clean and simple. This is where the "2h" label comes from.
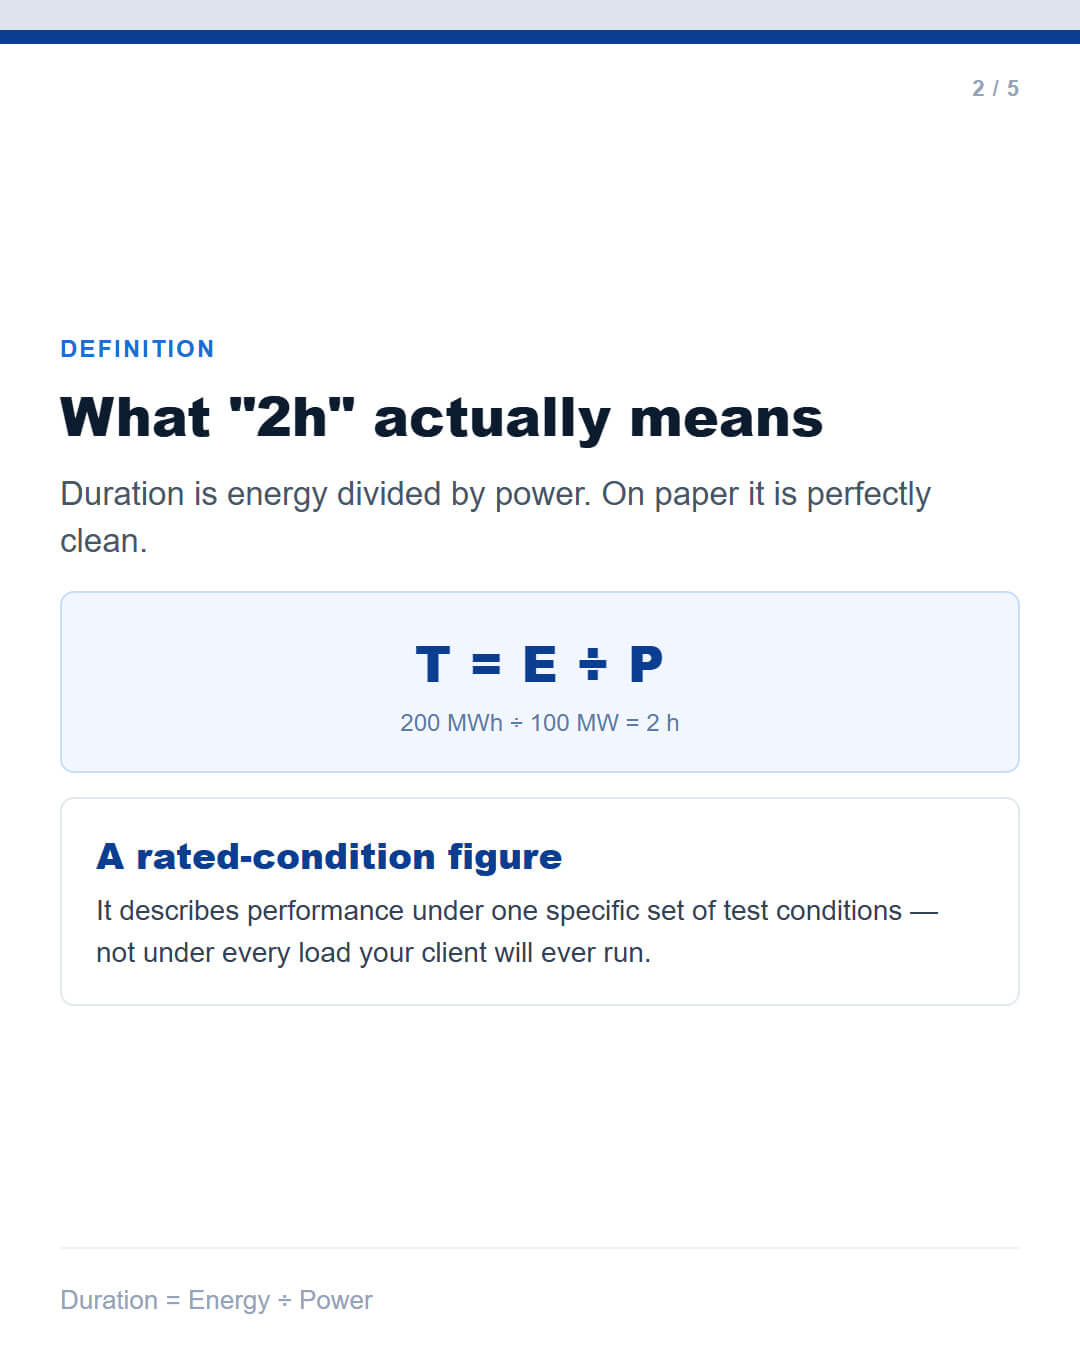
What the label does not say is that this is a rated-condition figure. It describes performance under one specific, controlled set of test conditions — not under every load your client will ever run.
The four conditions built into every nameplate figure
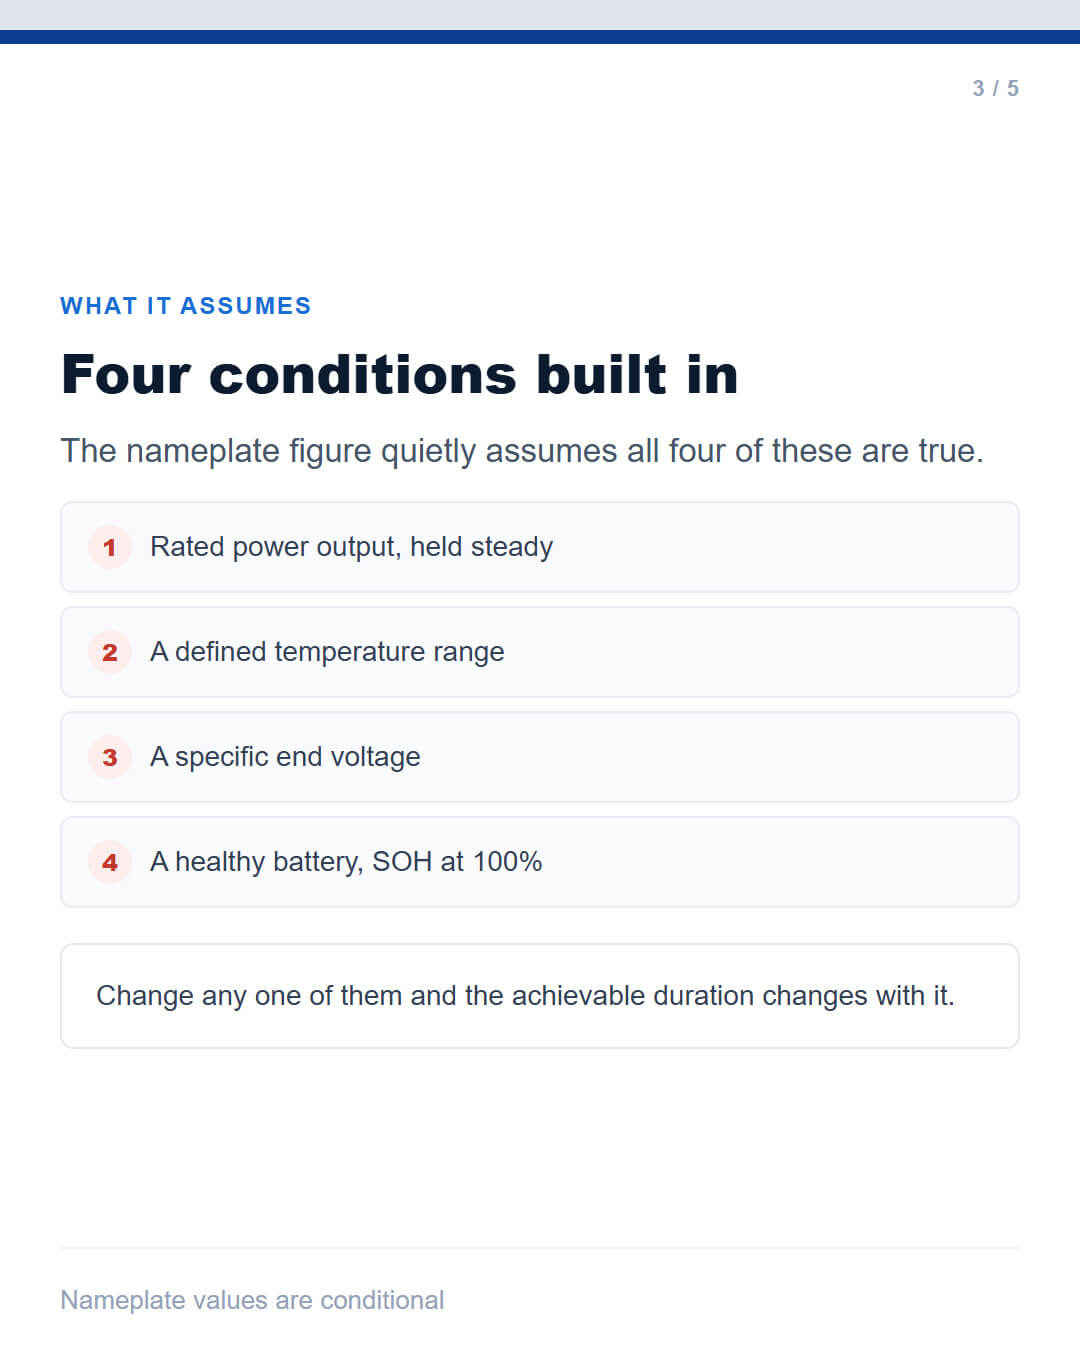
A rated duration assumes all four of the following are true. The datasheet rarely states them out loud.
| # |
Assumption |
What changes in reality |
| 1 |
Rated power output, held steady |
Real loads fluctuate; peaks draw harder than averages |
| 2 |
A defined temperature range |
High ambient temperature reduces usable capacity |
| 3 | A specific end voltage |
Cut-off behaviour depends on the load profile |
| 4 | A healthy battery at SOH 100% |
Every system ages; deliverable capacity declines |
Change any one of them, and the achievable duration changes with it. Change two or three — which is what actually happens on a real site — and the difference becomes material.
Why Philippine conditions make this especially relevant
Three factors converge here in a way that makes duration claims worth scrutinising carefully.
High ambient temperature. Much of the year runs hot. Usable capacity is temperature-dependent, and thermal management has a direct effect on how much of the rated figure is achievable in practice.
Loads that are not constant. Real installations rarely draw a flat, predictable load. Air conditioning, refrigeration, pumps and motors cycle on and off, and their start-up draw can be considerably higher than their running draw. A duration figure calculated against steady rated output does not describe this behaviour.
Typhoon-season outage patterns. Outages during typhoon season are not uniform. They can be short and frequent, or long and sustained. A system designed against an average outage assumption may perform poorly against the actual pattern.
The mistake and the reality
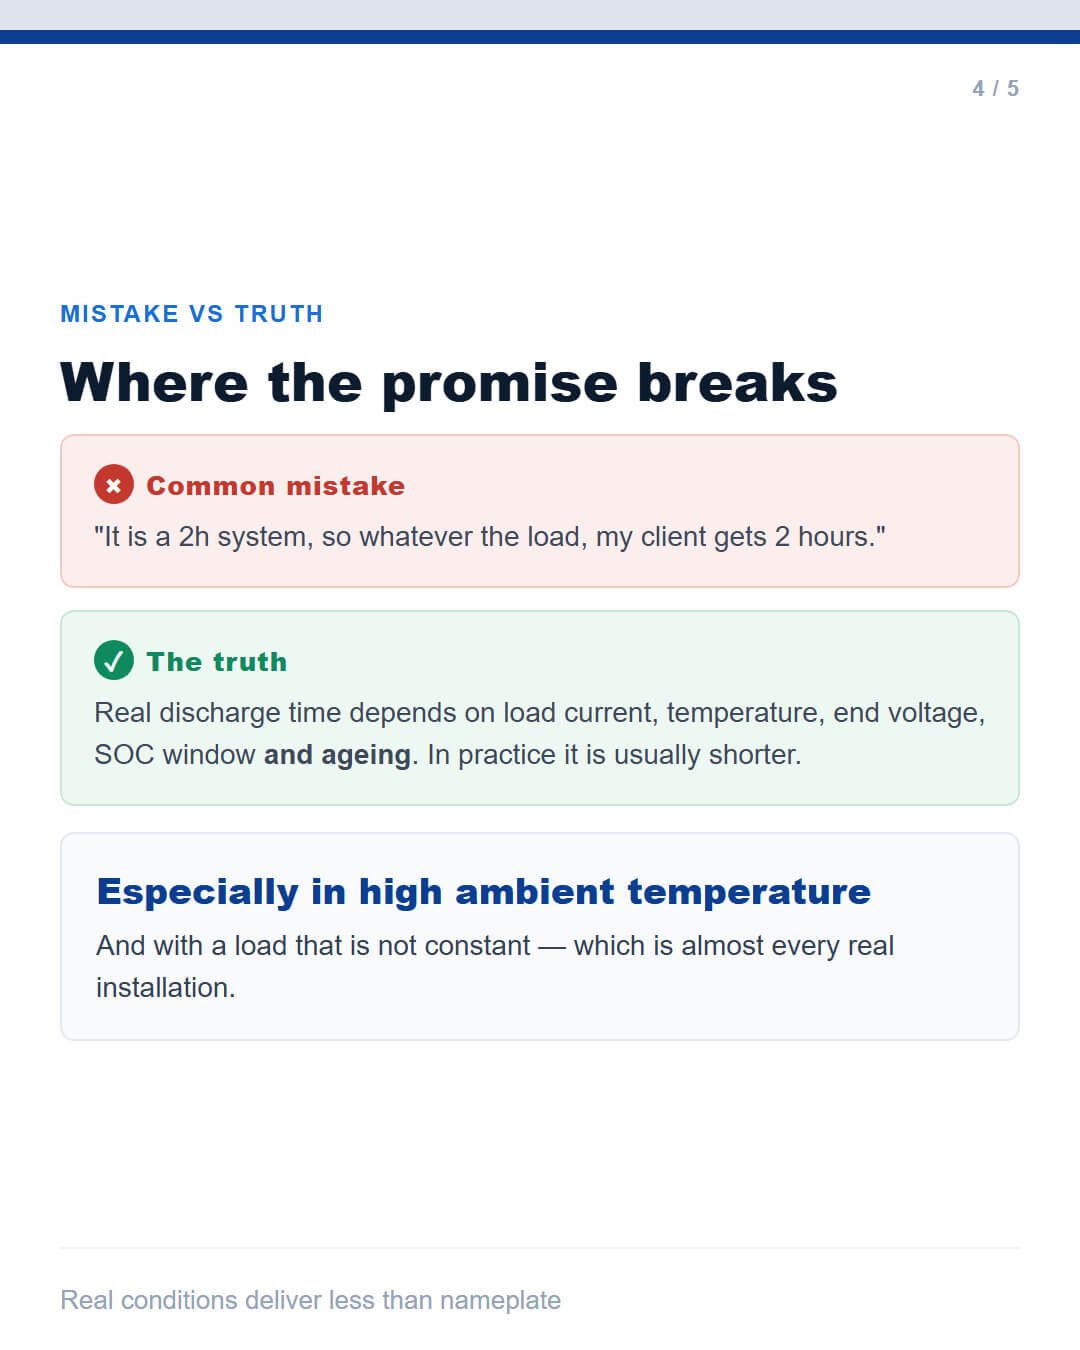
| Common mistake: "It is a 2h system, so whatever the load, my client gets 2 hours." |
This treats a rated figure as an unconditional guarantee. It is not one.
The reality: real discharge time depends on load current, temperature, end voltage, the usable SOC window, and ageing. Under real conditions, the achievable duration is often shorter than the nameplate figure.
There is a second, related mistake worth naming:
|
Common mistake: "A 100 MWh system is the same as a 200 MWh system, just cheaper." |
The reality: at the same power rating, capacity decides how long the load can be served. Consider a 200 MWh system at different power ratings:
| Load (MW) |
Duration |
| 5 MW |
40 hours |
| 10 MW |
20 hours |
| 50 MW |
4 hours |
| 100 MW |
2 hours |
The capacity never changed. The load did — and duration moved with it.
How to size for the outage, not the label
Four steps that produce a design you can stand behind.
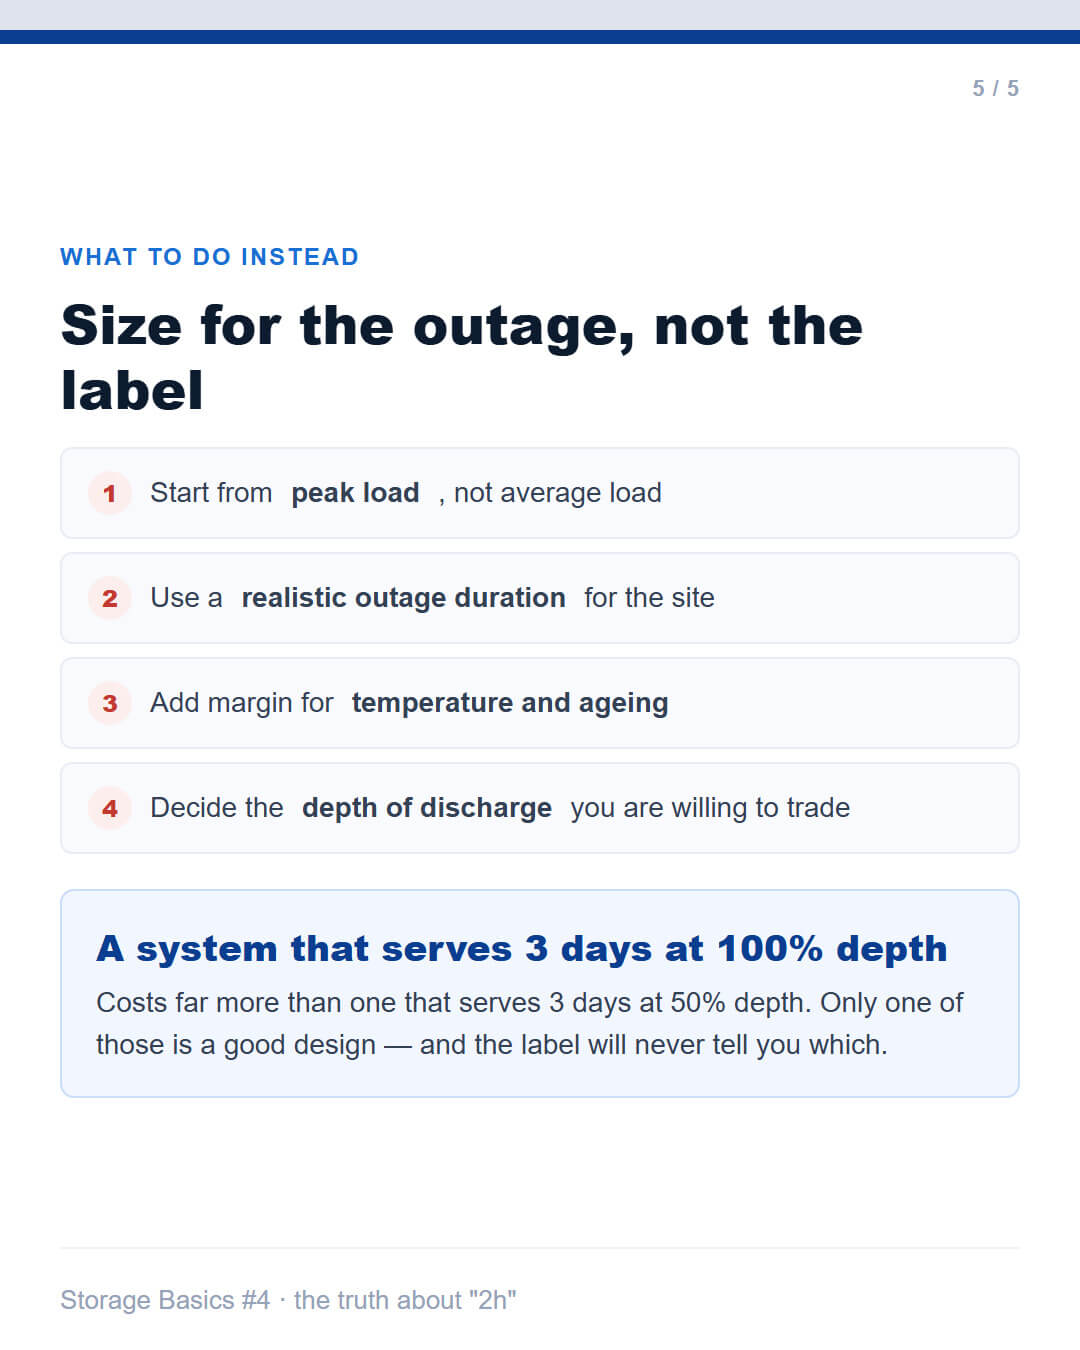
Step 1 — Start from peak load, not average load
Identify what actually draws the most power simultaneously. Start-up surges from motors and compressors matter here. A system sized on average load will underserve peak demand.
Step 2 — Use a realistic outage duration for the site
Not a national average — a realistic figure for this specific location and this specific client's tolerance. A hospital, a cold storage facility and a household have very different requirements, even under the same typhoon.
Step 3 — Add margin for temperature and ageing
Design for the end of life, not day one. A battery that delivers its rated output when new will deliver less after years of cycling. Build that decline into the specification.
Step 4 — Decide the depth of discharge you are willing to trade
This is the design decision that most directly shapes both cost and longevity.
A system that serves three days of critical load at 100% depth of discharge costs considerably more than one that serves three days at 50% depth. Both may be technically valid. Only one is a good design for a given client — and the nameplate label will never tell you which.
Deeper discharge also ages the battery faster. The depth you choose is, quite directly, the life you get.
A practical framing for client conversations
When a client asks "how many hours will it run," the honest and useful answer has three parts:
What the rated figure is — and that it is derived from specific test conditions
What their actual load profile looks like — which is what really determines runtime
What margin has been designed in — so the answer holds up in year five, not just year one
Sizing for peak load with margin for temperature and ageing is what separates a system that still performs in its fifth typhoon season from one that generates a support call in its first.
Frequently asked questions
Does a "2h battery" mean the battery physically lasts 2 hours? No. It means that under rated conditions — rated power, a defined temperature range, a specific end voltage and a healthy battery — the system can sustain rated output for approximately two hours. Real conditions typically reduce this.
Why is my runtime shorter in hot weather? Usable capacity is temperature-dependent. High ambient temperature reduces the energy the system can deliver, which shortens runtime at a given load. This is why thermal management directly affects real-world performance in tropical climates.
Should I size for the worst case or the average case? For backup applications, size for a realistic worst case at the site — peak load plus a credible outage duration — then add margin for temperature and ageing. Sizing on averages tends to disappoint precisely when the system is needed most.
How does depth of discharge affect my design? Deeper discharge extracts more energy per cycle but ages the battery faster and requires more capacity to serve the same load reliably. Shallower discharge extends life but needs a larger system. It is a cost-versus-longevity trade, and it should be an explicit decision rather than a default.
Can I compare duration claims across different suppliers? Only if you compare like with like. Ask each supplier for the conditions behind the figure: the power rating, the temperature assumption, the end voltage, and the depth of discharge. A duration number without its conditions is not comparable to anything.
What about cycle life figures quoted alongside duration? Cycle life always comes with test conditions as well — depth of discharge, C-rate, temperature and end-of-life criterion. Change any one and the number changes. Always ask for the condition sheet before comparing.
In Filipino (Tagalog)
Paalala sa mga installer:
Ang "2h" ay hindi garantisadong 2 oras sa lahat ng sitwasyon. Naka-base ito sa rated na kondisyon:
Rated power output
Takdang temperatura
Takdang end voltage
Malusog na baterya (SOH 100%)
Sa totoong operasyon — lalo na sa tag-init at sa panahon ng brownout — mas maikli ito kaysa sa nakasulat.
Paano mag-size nang tama:
Simulan sa peak load, hindi average
Gamitin ang totoong tagal ng outage para sa site na iyon
Magdagdag ng margin para sa temperatura at ageing
Pagpasyahan ang depth of discharge na kaya mong i-trade
Ang sistema na nagse-serve ng 3 araw sa 100% depth ay mas mahal kaysa sa isa na nagse-serve ng 3 araw sa 50% depth. Alin ang tamang disenyo? Depende sa pangangailangan ng kliyente.
Formula: T = E ÷ P (Tagal = Enerhiya ÷ Power)
Related guides in this series
MW vs MWh: why power and capacity are two different things
The C-rate trap: why 0.5C is not 50% of rated power
What SOC actually tells you — and what it does not
All figures in this article are illustrative examples used to explain the underlying principles. They do not represent the specifications of any particular product. For current terms, availability and technical documentation, please contact us.
Storage Basics is an educational series from VANYO's overseas team, written for installers, EPCs and system integrators working in the Philippine market.
 SOC, SOH and DOD: Three Battery Metrics That Answer Three Different Questions

 Address: Wanyang Gold and Silver Building 6, Circular Economy Park, Sili Town, Jiyuan City, Henan Province, China