
 Home

What SOC Actually Tells You — And What It Does Not
A client looks at the monitoring app, sees SOC 80%, and asks a reasonable question: "So we have 80% of the energy available, right?"
The honest answer is no. And explaining why is one of the more useful conversations an installer can have, because it sets expectations correctly before they become a complaint.
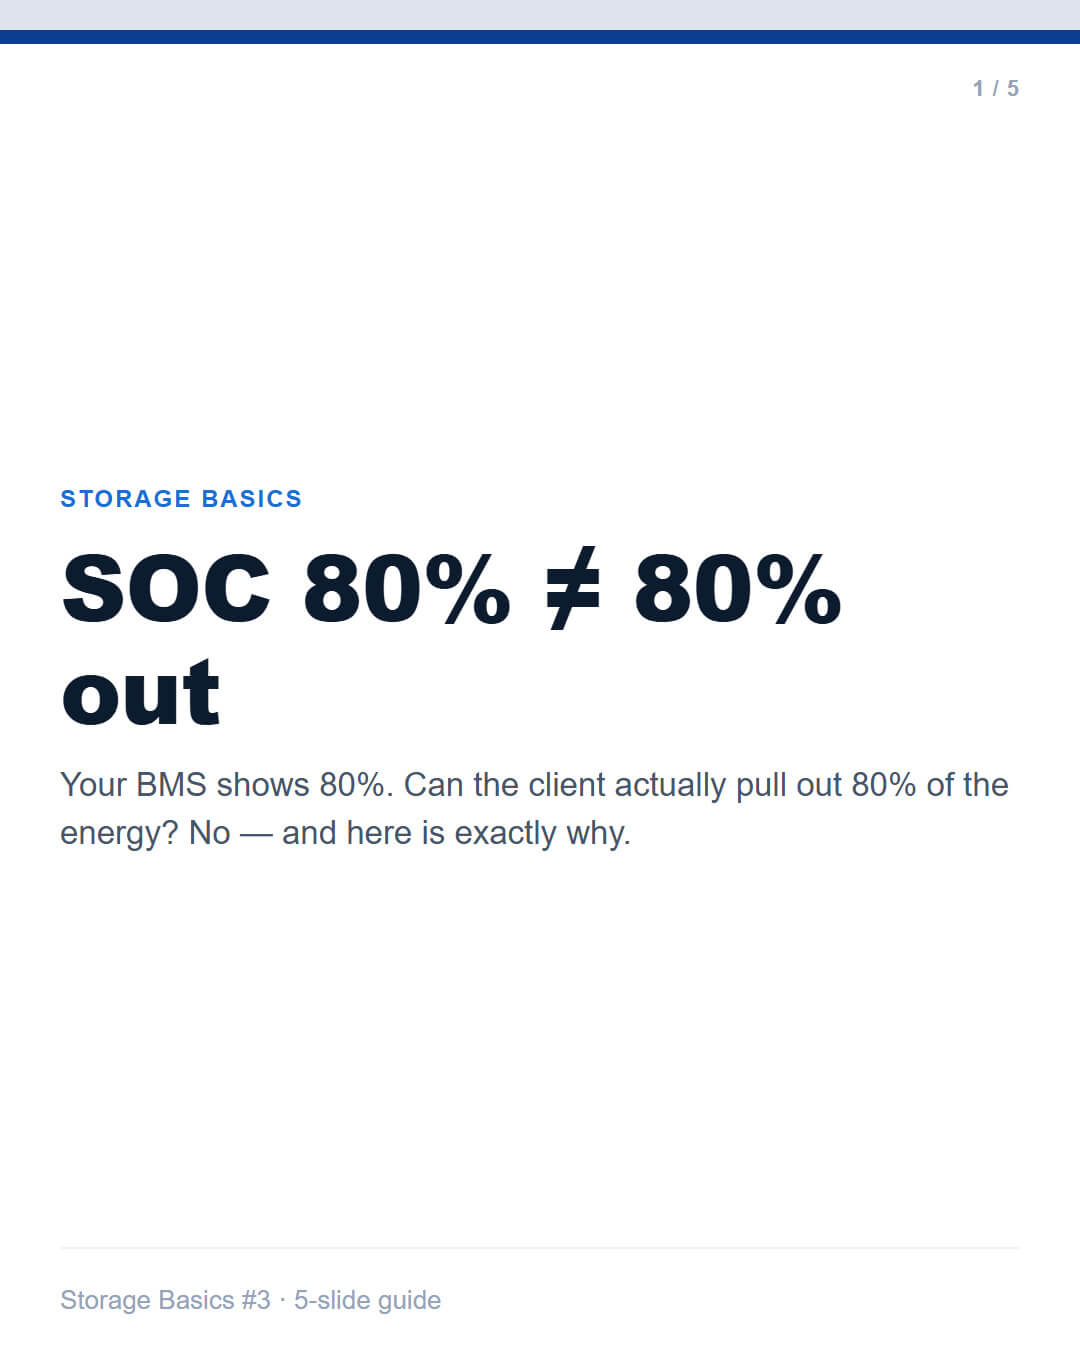
This guide walks through what State of Charge measures, what sits between the reading and the reality, and how to size projects so the site delivers what you promised.
What SOC is
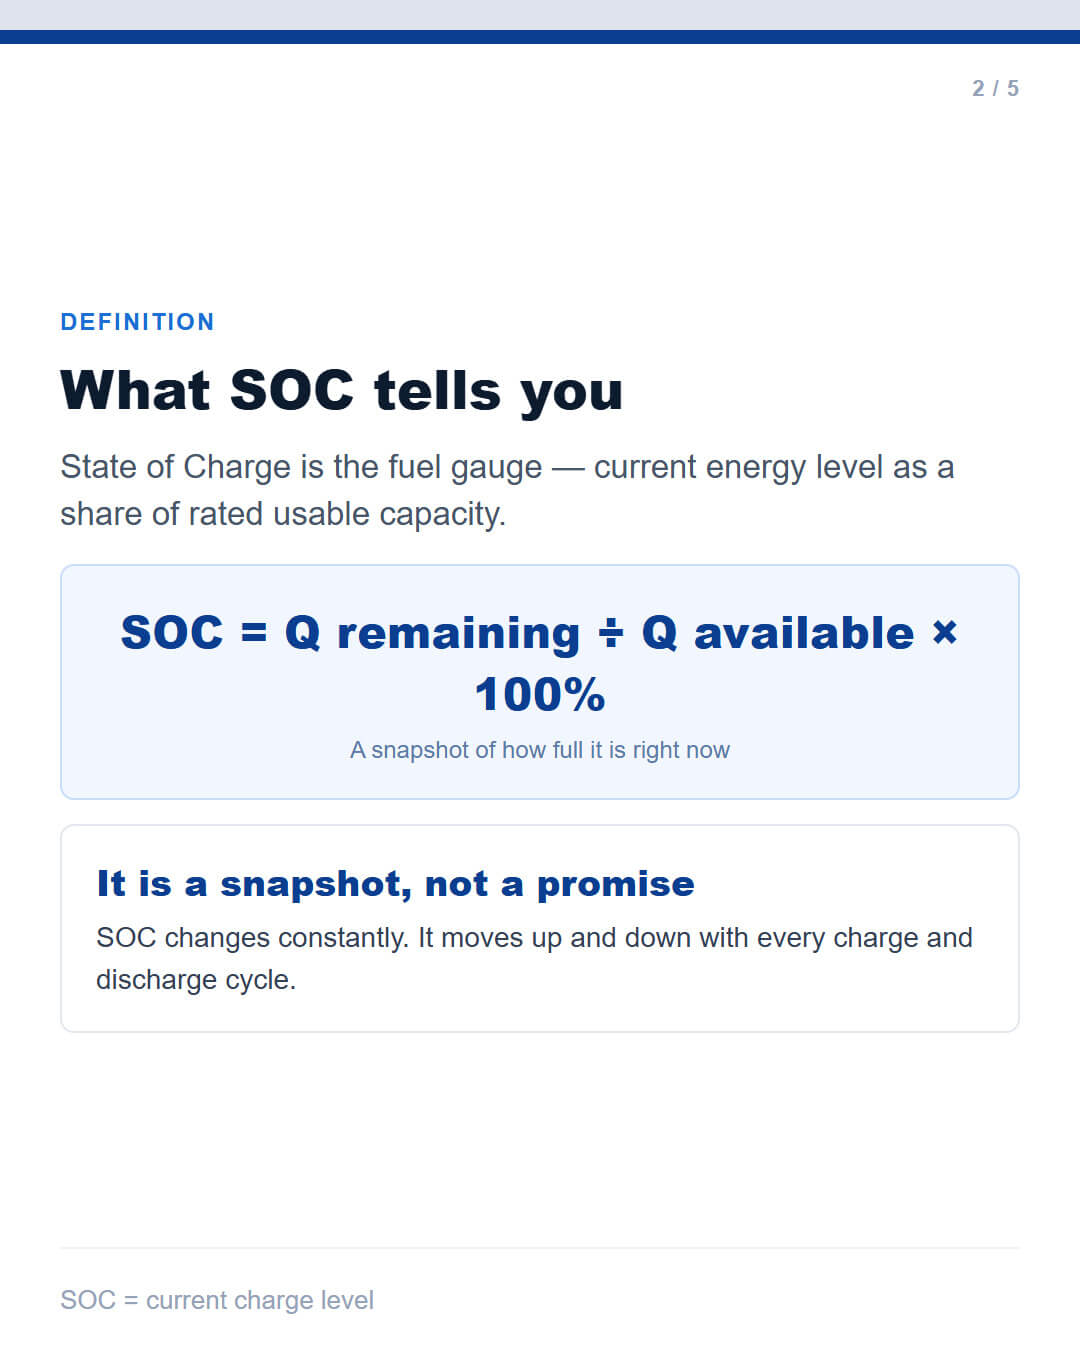
SOC — State of Charge — is the fuel gauge. It reports the current energy level as a share of rated usable capacity.
|
SOC = Q remaining ÷ Q available × 100% |
It answers exactly one question: how full is it right now?
That is genuinely useful information. It tells you where the battery sits in its operating range at this moment. Operators use it constantly.
What it is not is a prediction of how much energy you can get out.
Three reasons deliverable energy is lower
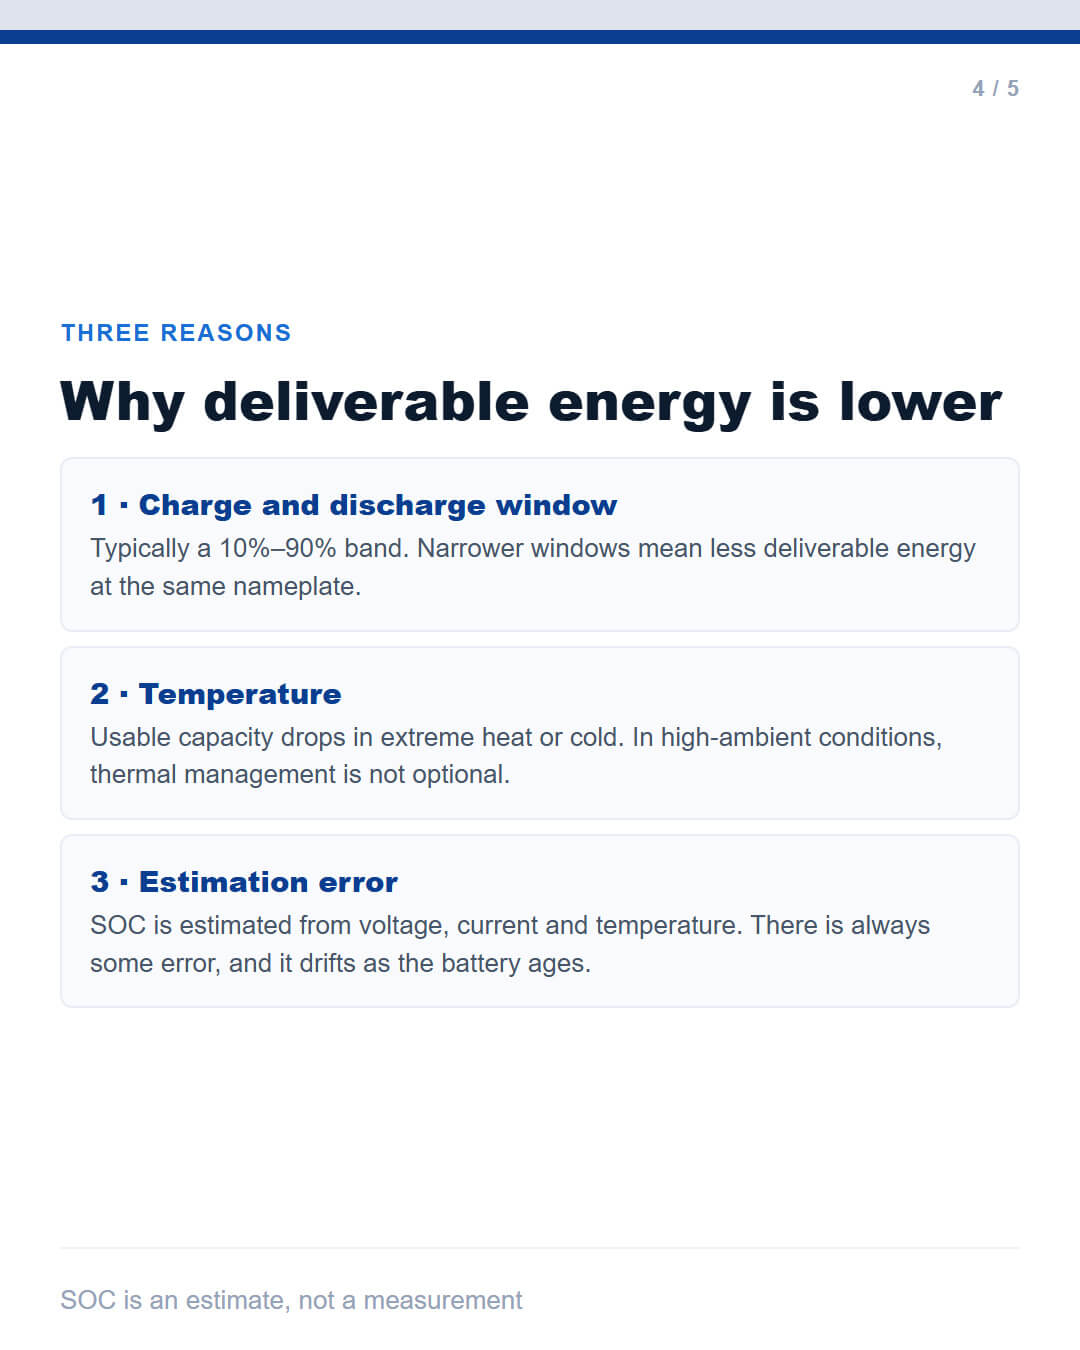
The gap between the SOC reading and the energy you can actually extract comes from three sources. All three are normal, and all three are worth understanding.
1. The usable operating window
Most systems run a 10%–90% SOC band rather than 0%–100%.
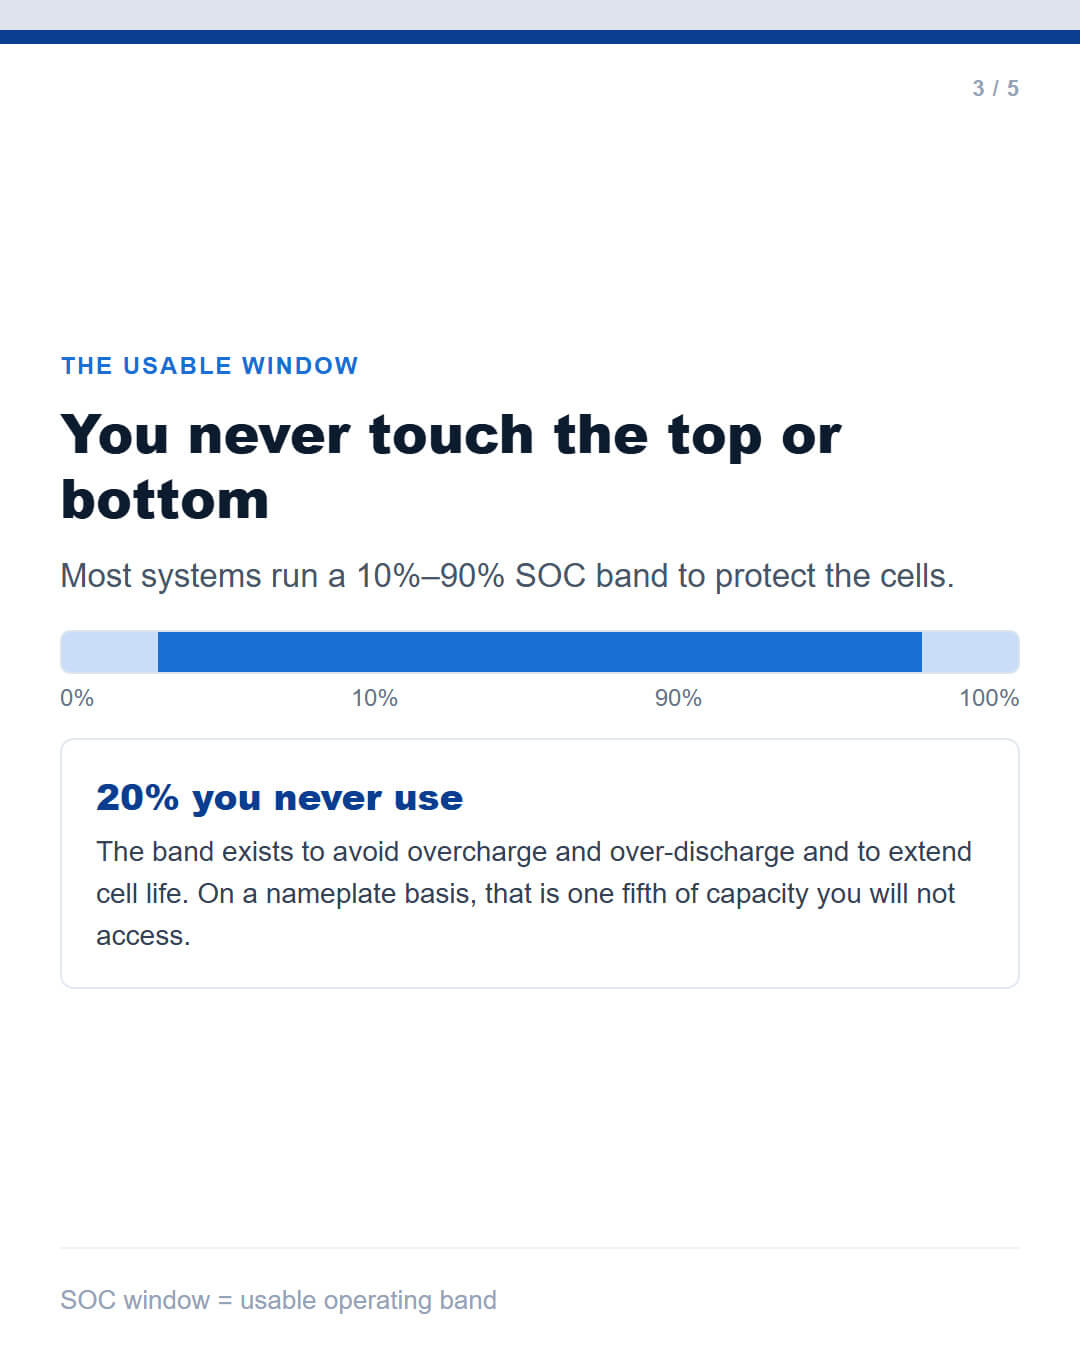
This is deliberate. The band exists to avoid overcharge and over-discharge, both of which accelerate cell degradation. It is a protection measure, not a limitation of the technology.
The practical consequence: roughly one fifth of the nameplate sits outside the operating window. You will not access it in normal operation.
|
Band |
What it means |
| 0% – 10% |
Lower guard band — not used |
| 10% – 90% |
Normal operating range |
| 90% – 100% |
Upper guard band — not used |
2. Temperature
Usable capacity is temperature-dependent. Performance drops in extreme heat and extreme cold alike.
In Philippine ambient conditions, high temperature is the relevant concern for much of the year. Thermal management is not a luxury feature in this climate — it directly affects how much of the rated capacity you can actually deliver.
3. Estimation error
SOC is not measured directly. It is estimated from voltage, current and temperature readings.
In practice this means:
There is always some error in the figure displayed
The error tends to grow as the battery ages
Accuracy varies across the operating range — estimation is generally easier in the middle of the band than at the extremes
So the number on the screen is a well-informed estimate, not a measurement.
The mistake and the reality
| Common mistake: "SOC 80% means I can discharge 80% of rated capacity." |
This conflates the current charge level with the deliverable energy. They are related but not equal.
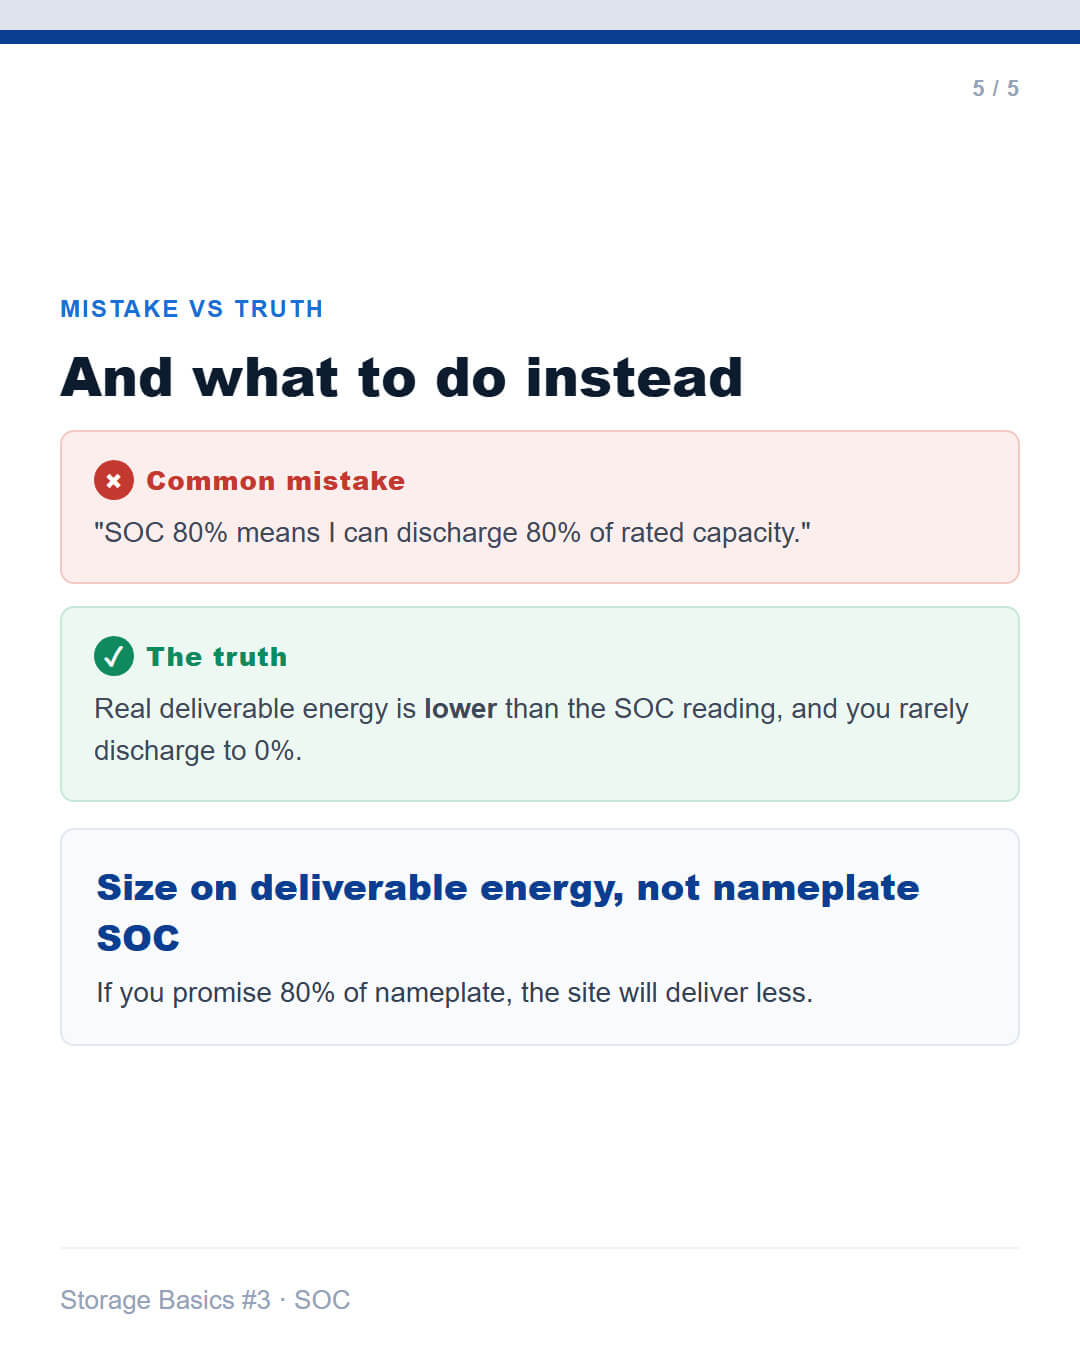
The reality: real deliverable energy is lower than the SOC reading suggests, and in practice you rarely discharge all the way to 0%.
What to tell your client
A workable way to frame it:
| "SOC tells us how full the battery is right now. The energy we can actually draw from it will be a bit lower than that figure, because the system keeps a safety margin at the top and bottom, hot weather reduces usable capacity, and the reading itself is an estimate. That is why we size the system with margin — so the amount you need is comfortably inside what the system can deliver." |
That is accurate, honest, and prevents a misunderstanding that would otherwise surface later.
Sizing on deliverable energy, not nameplate SOC
The design implication is straightforward: size the system on deliverable energy, not on the SOC reading.
Three practical rules:
Add margin for the operating window. If you need 100 kWh delivered, do not specify a 100 kWh nameplate system. Allow for the guard bands.
Add margin for temperature. Especially in high-ambient installations. Thermal derating is real and predictable.
Add margin for ageing. A system delivering its full rated output when new will deliver less after several years of cycling. Design for the end of life, not just day one.
If you promise a client 80% of nameplate, the site will deliver less. If you promise what the system can genuinely deliver with margin, you build a reputation instead of a complaint.
SOC, SOH and DOD: three different questions
These three acronyms appear together constantly and get mixed up just as constantly.
| Term |
Full name |
The question it answers |
| SOC |
State of Charge |
How full is it right now? |
| SOH |
State of Healt |
Is the battery still healthy? |
| DOD |
Depth of Discharge |
How deep did this cycle go? |
The mental model that works:
SOC = how much is left
DOD = how much you used
SOH = is it still healthy
A quick illustration of DOD: if SOC moves from 90% to 20%, the depth of that discharge is approximately 70%.
And a note on why this matters for system life: deeper DOD ages the battery faster. A unit cycled daily at 80% DOD will not last as long as one cycled at 50% DOD, even with identical cells. The depth you choose is the life you get.
Frequently asked questions
Why does SOC sometimes jump or drift? Because it is estimated rather than measured. As voltage, current and temperature readings shift, the estimate recalculates. Ageing increases the drift. A periodic full calibration cycle — where supported by the system — helps keep the estimate aligned.
Does SOC 100% mean the battery is fully charged? It means the system has reached its upper operating limit — which, with a 90% upper guard band, is not the same as the cell being at absolute maximum capacity. The guard band exists to protect cell life.
Can SOC be negative or above 100%? Displayed values normally stay within 0–100%. If you see readings outside that range, treat it as a signal to investigate the BMS calibration rather than as a real state.
How is this different from SOH? SOC is a short-term state that moves up and down every cycle. SOH is a long-term health indicator that only declines over the battery's life. One tells you where you are; the other tells you how much life is left.
Why does the SOC reading matter if it is only an estimate? Because it remains the best available indicator of current charge level, and it is essential for managing daily operation. The point is not to distrust it — it is to understand that it describes charge level, not deliverable energy, and to size accordingly.
In Filipino (Tagalog)
Paalala sa mga installer:
Ang SOC 80% ay hindi katumbas ng 80% na mailalabas na enerhiya.
Tatlong dahilan:
SOC window — kadalasan 10%–90% lang ang ginagamit, para protektahan ang cells
Temperatura — bumababa ang magagamit na capacity sa sobrang init
Estimation error — ang SOC ay tinataya mula sa voltage, current at temperatura, kaya may error
I-size ang sistema base sa tunay na mailalabas, hindi sa nameplate SOC.
Tandaan:
SOC = kung gaano pa karami ang natitira
DOD = kung gaano kalalim ang nagamit
SOH = kung malusog pa ang baterya
Related guides in this series
MW vs MWh: why power and capacity are two different things
The C-rate trap: why 0.5C is not 50% of rated power
Battery duration explained: the truth about the "2h" claim
All figures in this article are illustrative examples used to explain the underlying principles. They do not represent the specifications of any particular product. For current terms, availability and technical documentation, please contact us.
Storage Basics is an educational series from VANYO's overseas team, written for installers, EPCs and system integrators working in the Philippine market.
 Battery Duration Explained: The Truth About the

 Address: Wanyang Gold and Silver Building 6, Circular Economy Park, Sili Town, Jiyuan City, Henan Province, China